Planning Center Reporting

Stop spending Monday morning in Spreadsheets

Parable connects to Planning Center and turns your data into dashboards, trends, and answers.

No exports. No formulas. No guesswork.
Book A Demo
Parable platform overview dashboard showing key metrics: weekend attendance 3,287 (+9%), first-time guests 89 (+23.6%), salvations 28 (+27.3%), and baptisms 45 (-13.5%), with average attendance of 385 over 13 weeks.Dashboard interface showing key church metrics: weekend attendance 3,287 up 9%, first time guests 89 up 23.6%, salvations 28 up 27.3%, baptisms 45 down 13.5%, and average attendance of 385.
Sound Familiar?

The Monday Morning Struggle

You didn't become a pastor to wrestle with spreadsheets. But here we are. 

Monday Morning Spreadsheet Marathon

You spend hours exporting, copying, and formatting the perfect spreadsheet to share with your team, but the report is out of date the moment you send it.

I don't know

When leadership asks follow-up questions, you have to go back and pull more data. Again.

Data Everywhere. Answers Nowhere.

Attendance in Check-ins. Giving in Giving. Groups in Groups. No easy way to see how a person is connected to all parts of your church.
Planning Center is great at collecting data. Getting answers from that data? That's another story.
A Better Story

There's a Better Way

Parable syncs with Planning Center and gives you one place to see attendance, giving, groups, and engagement—together.

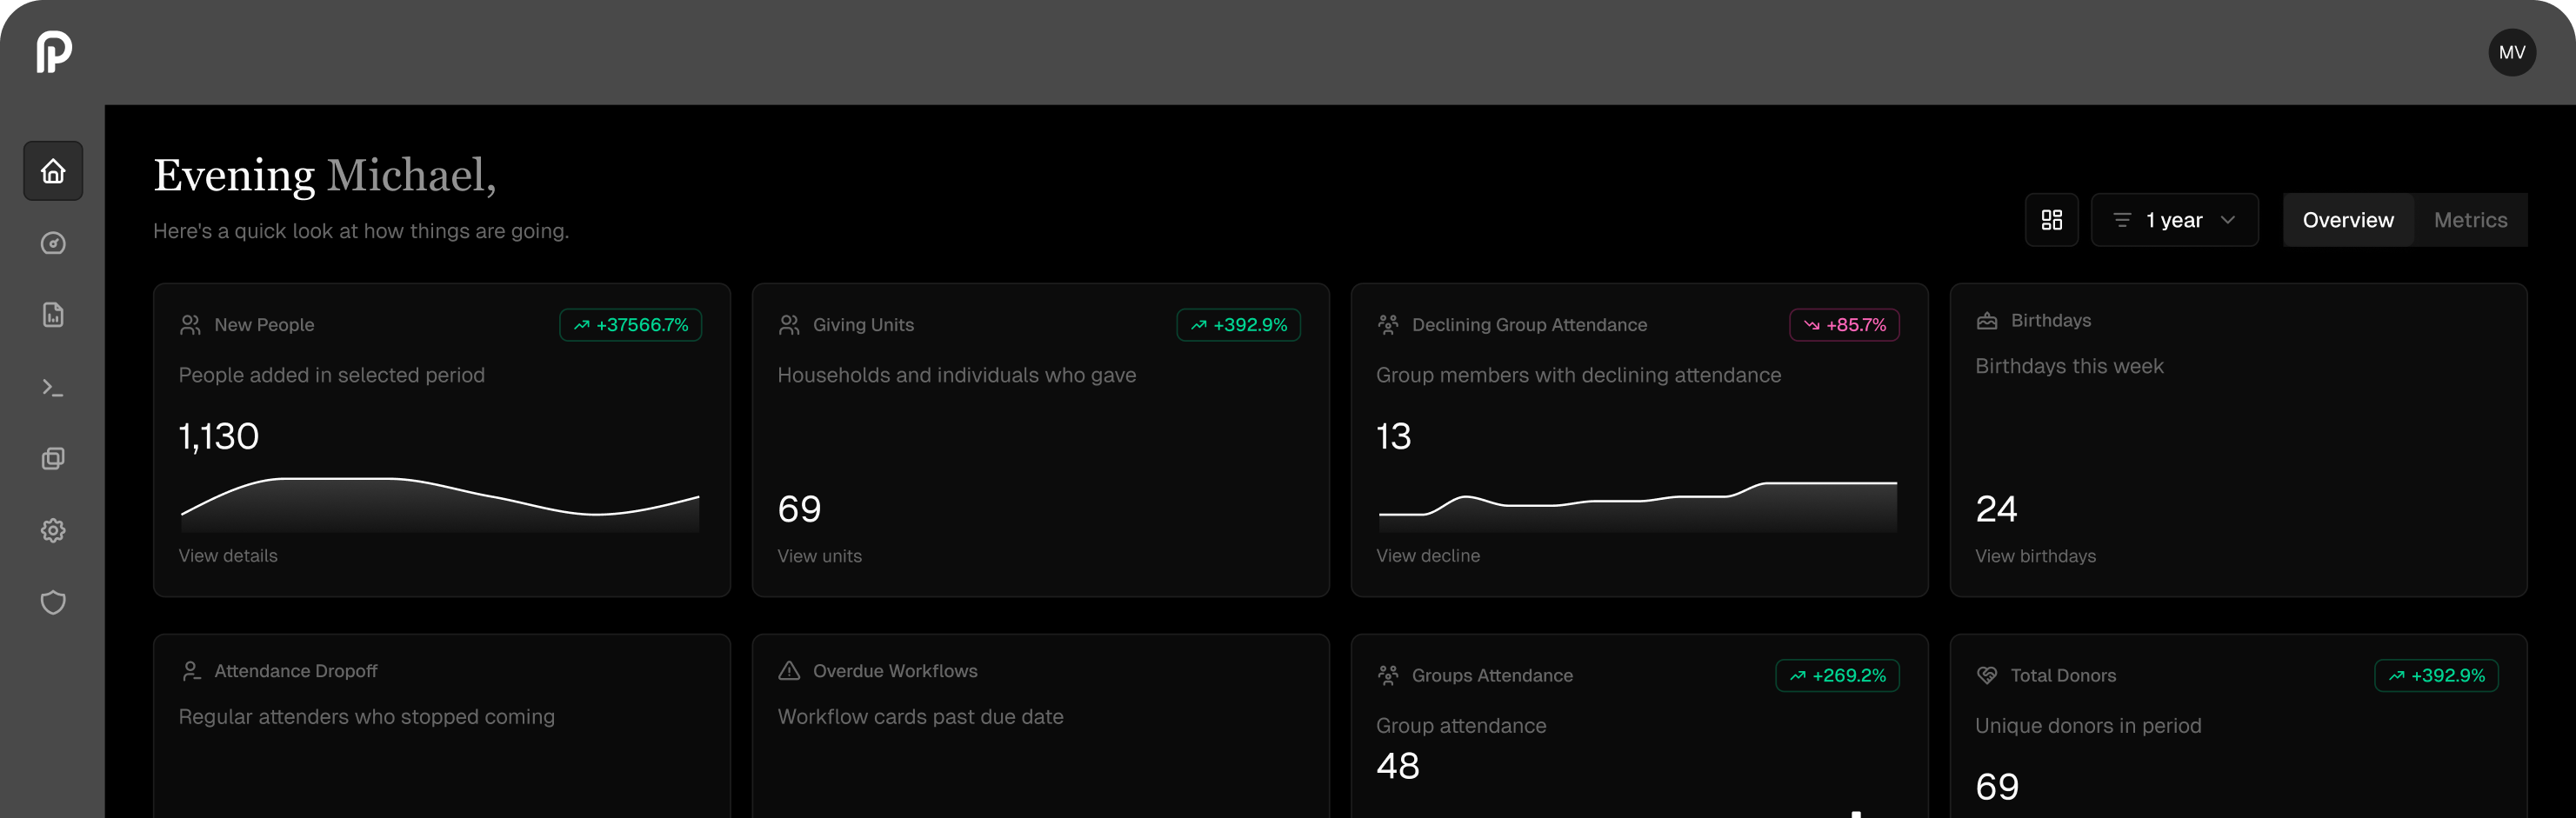
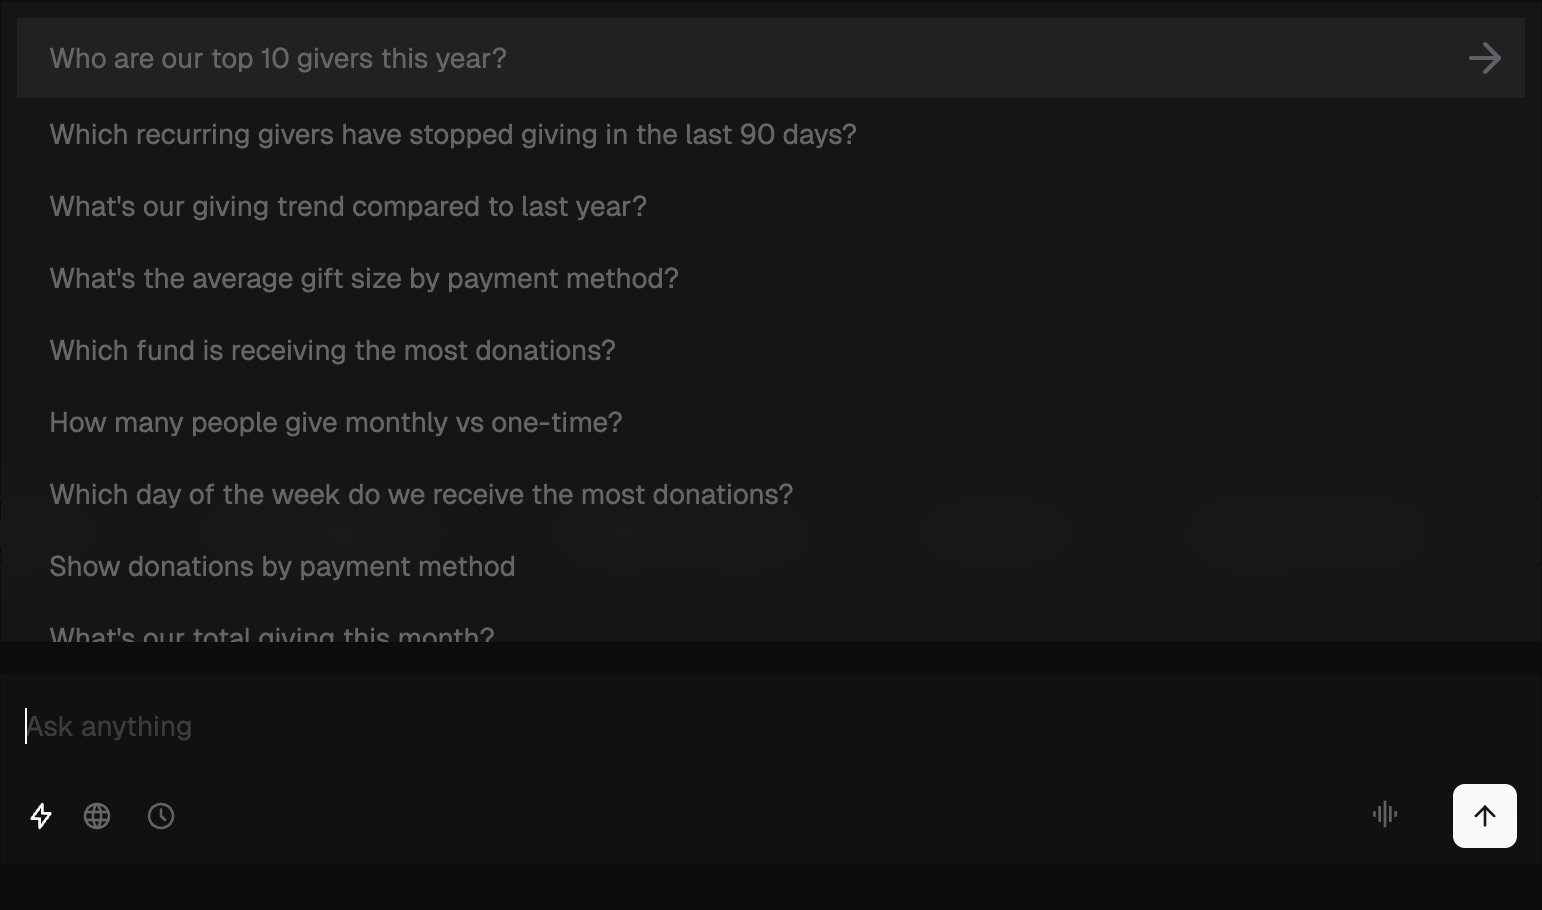
Ask Questions in Plain English

How many first-time guests returned last month?" and get an answer instantly. No exports. No reports. Just questions and answers.
Attendance chart showing a 13-week average attendance of 385, with 105 kids and 312 adults on June 15.

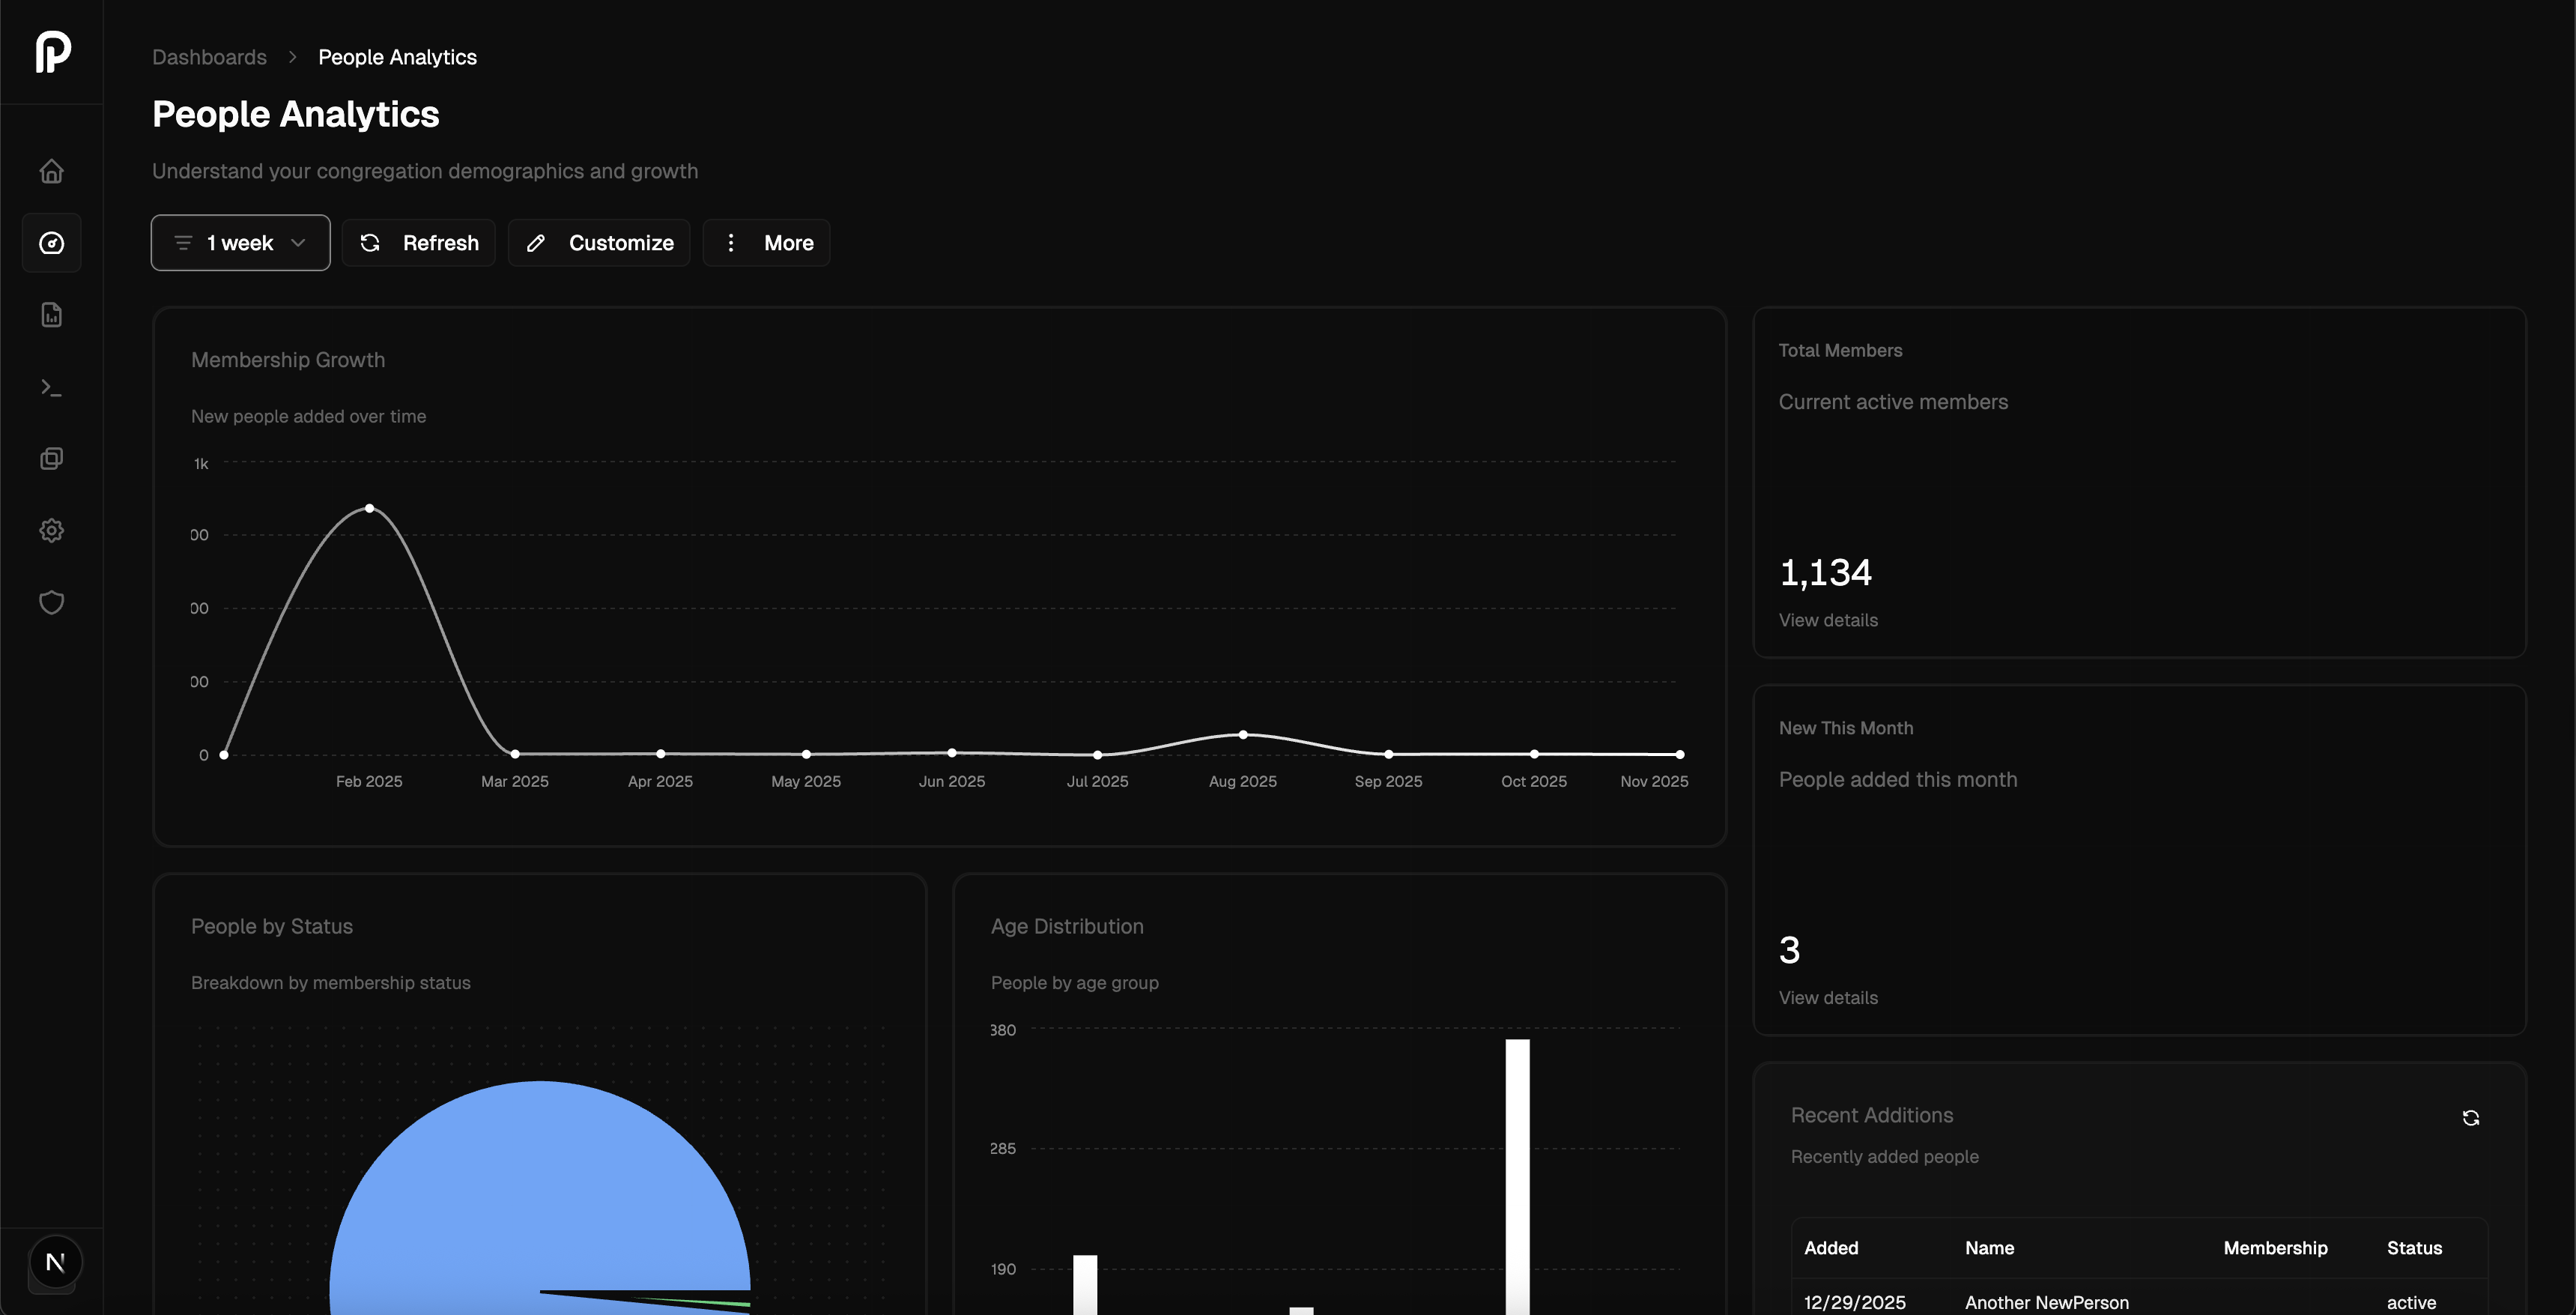
See the full Picture

All your Planning Center data in one view. Track who's in groups, who's serving, who's giving—and spot who's drifting before they disappear.
Two circular progress charts showing 68% active people in groups with a 75% goal, and 42% active people serving with a 50% goal.

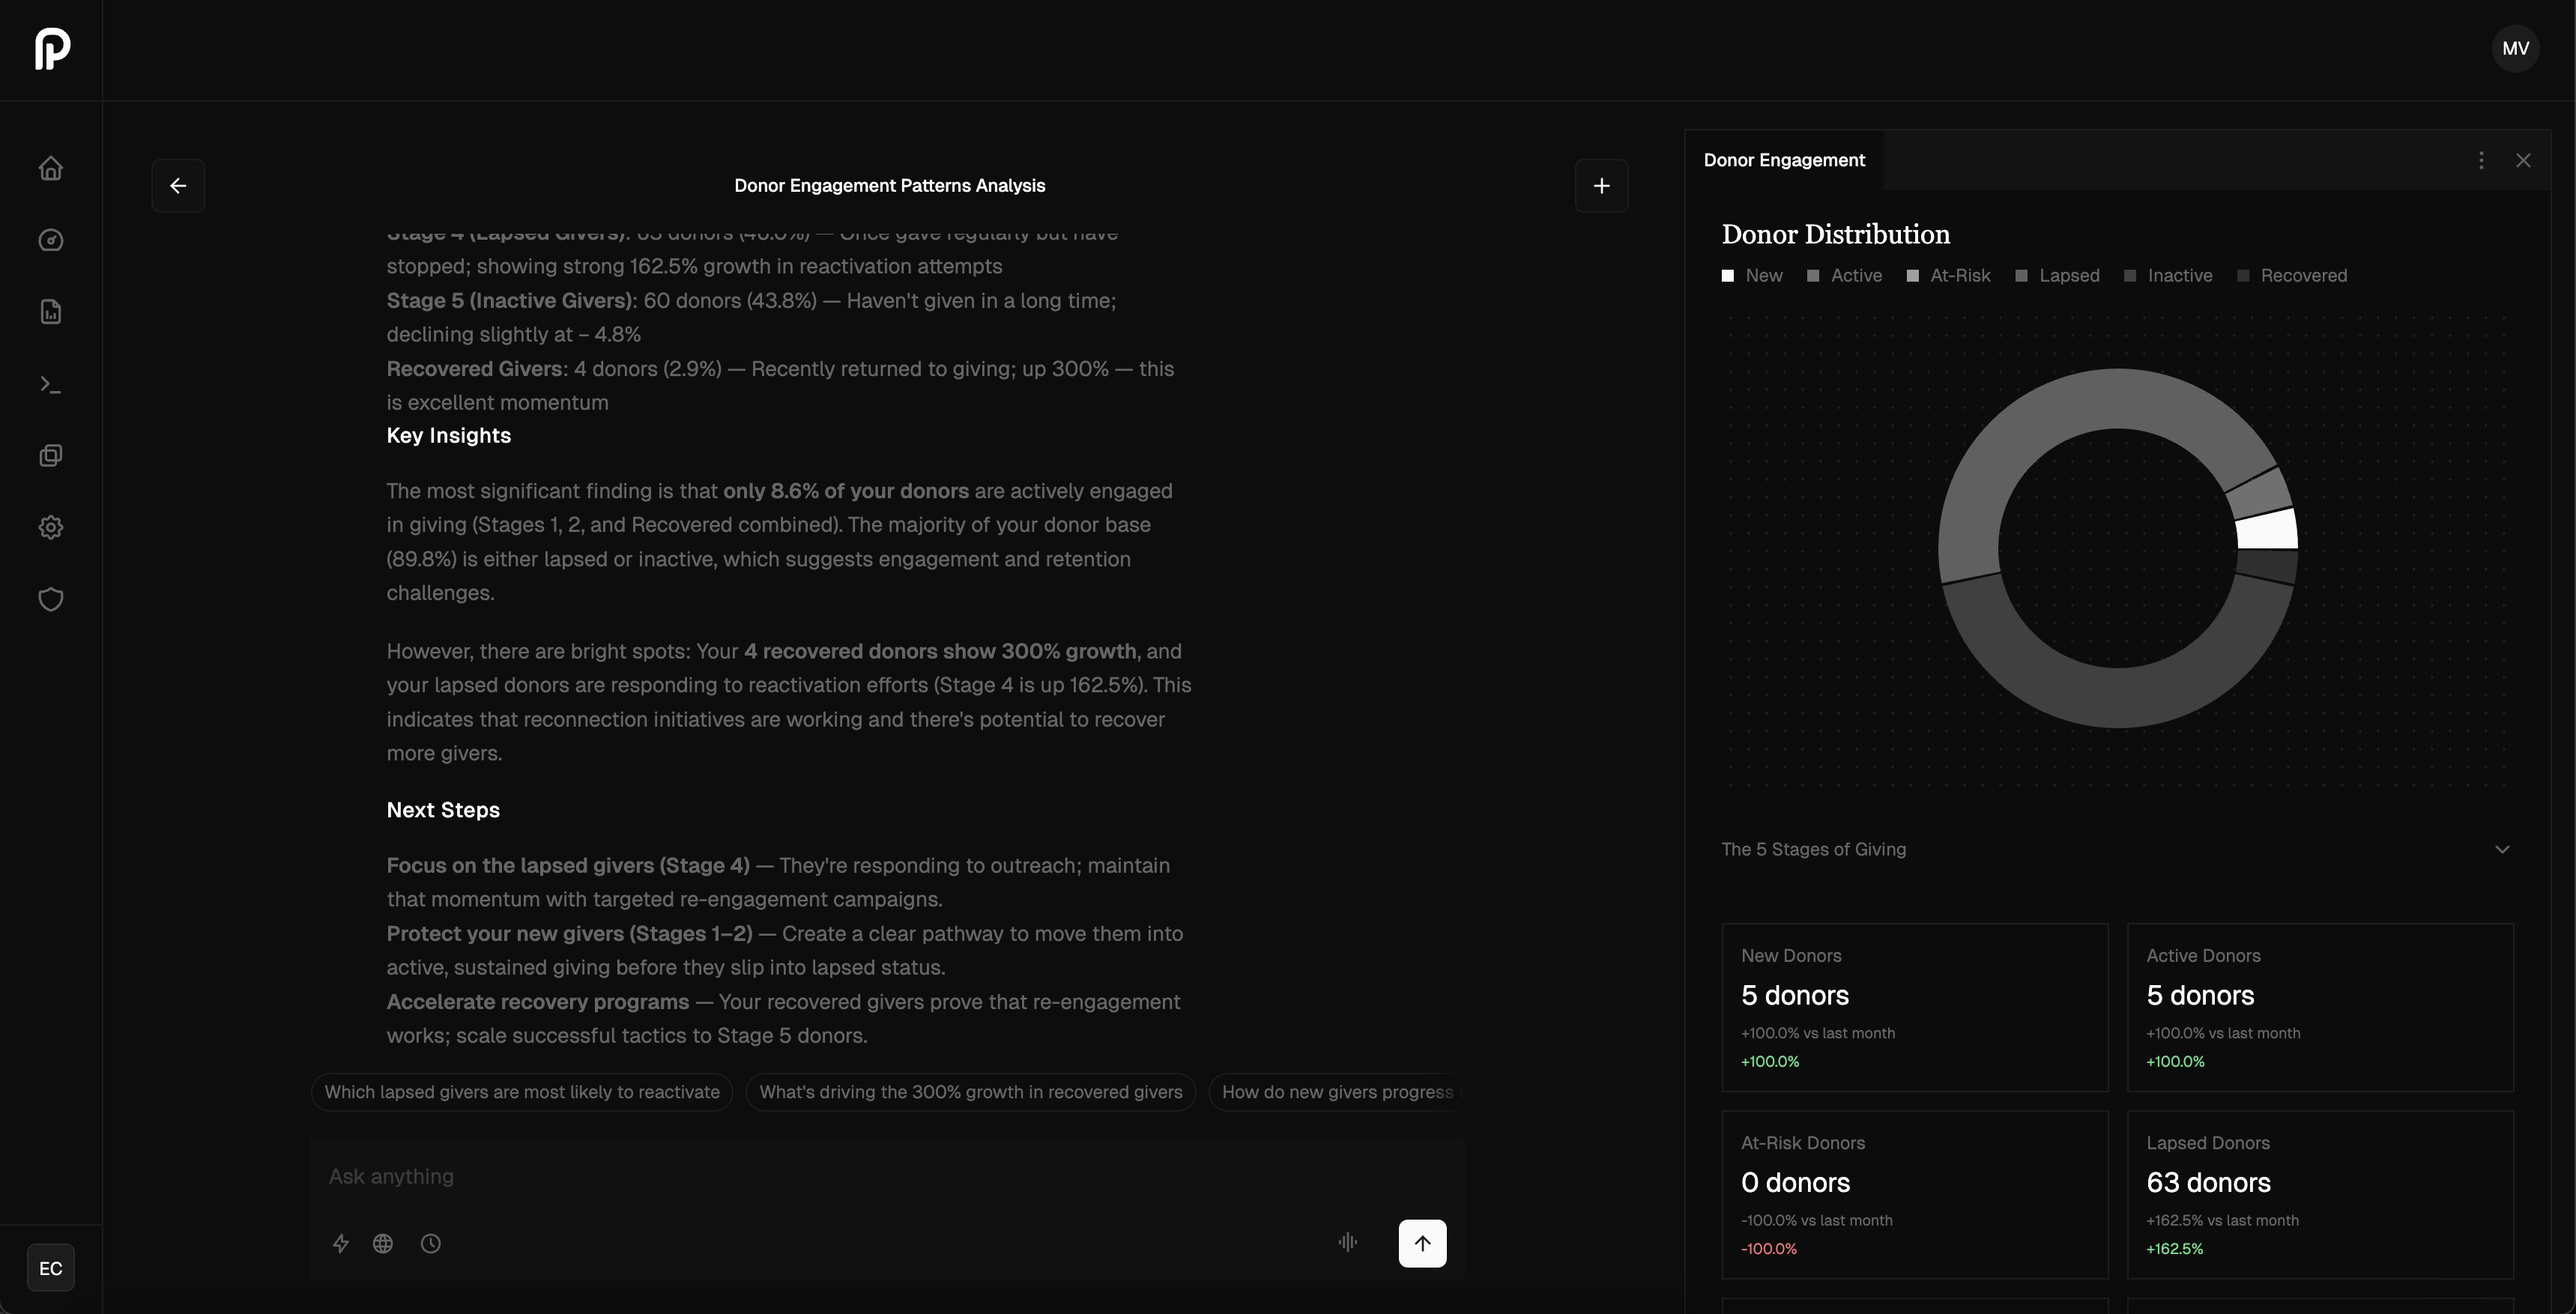
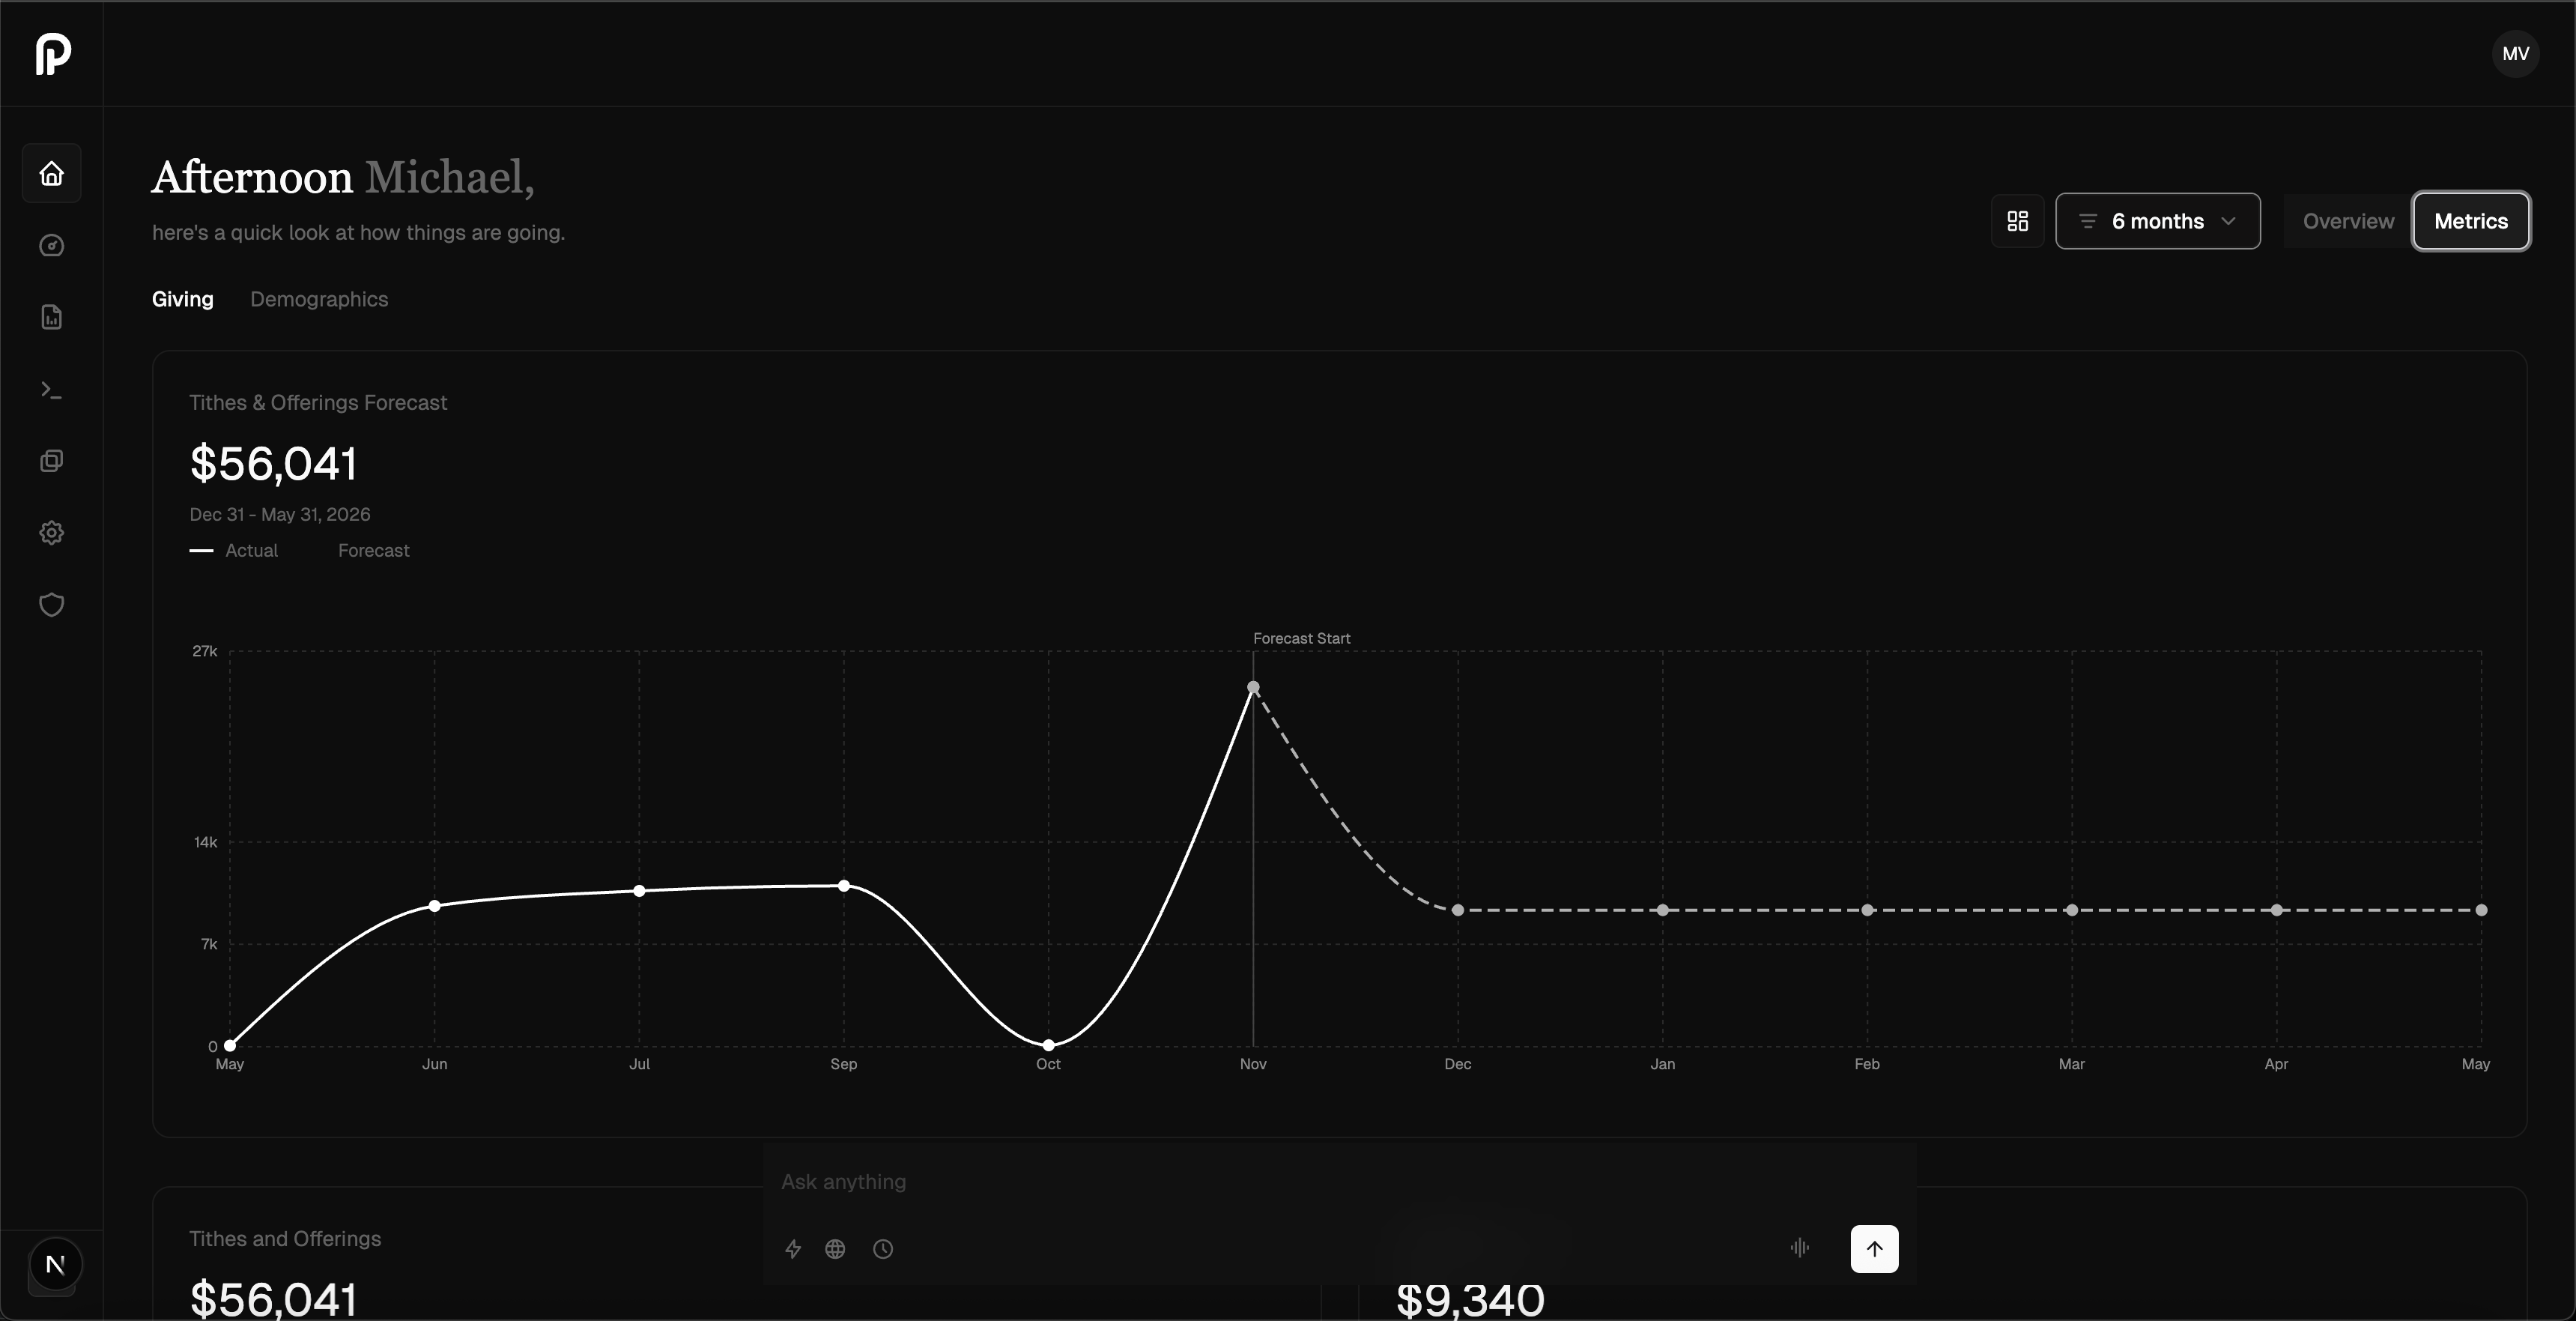
Trends Planning Center Can't Show

Year-over-year comparisons. Forecasts. Patterns. Finally see if you're growing, plateauing, or declining—and why.
Dashboard showing Giving at 35% of active people with a goal of 40%, and Members at 10% with a goal of 25%.

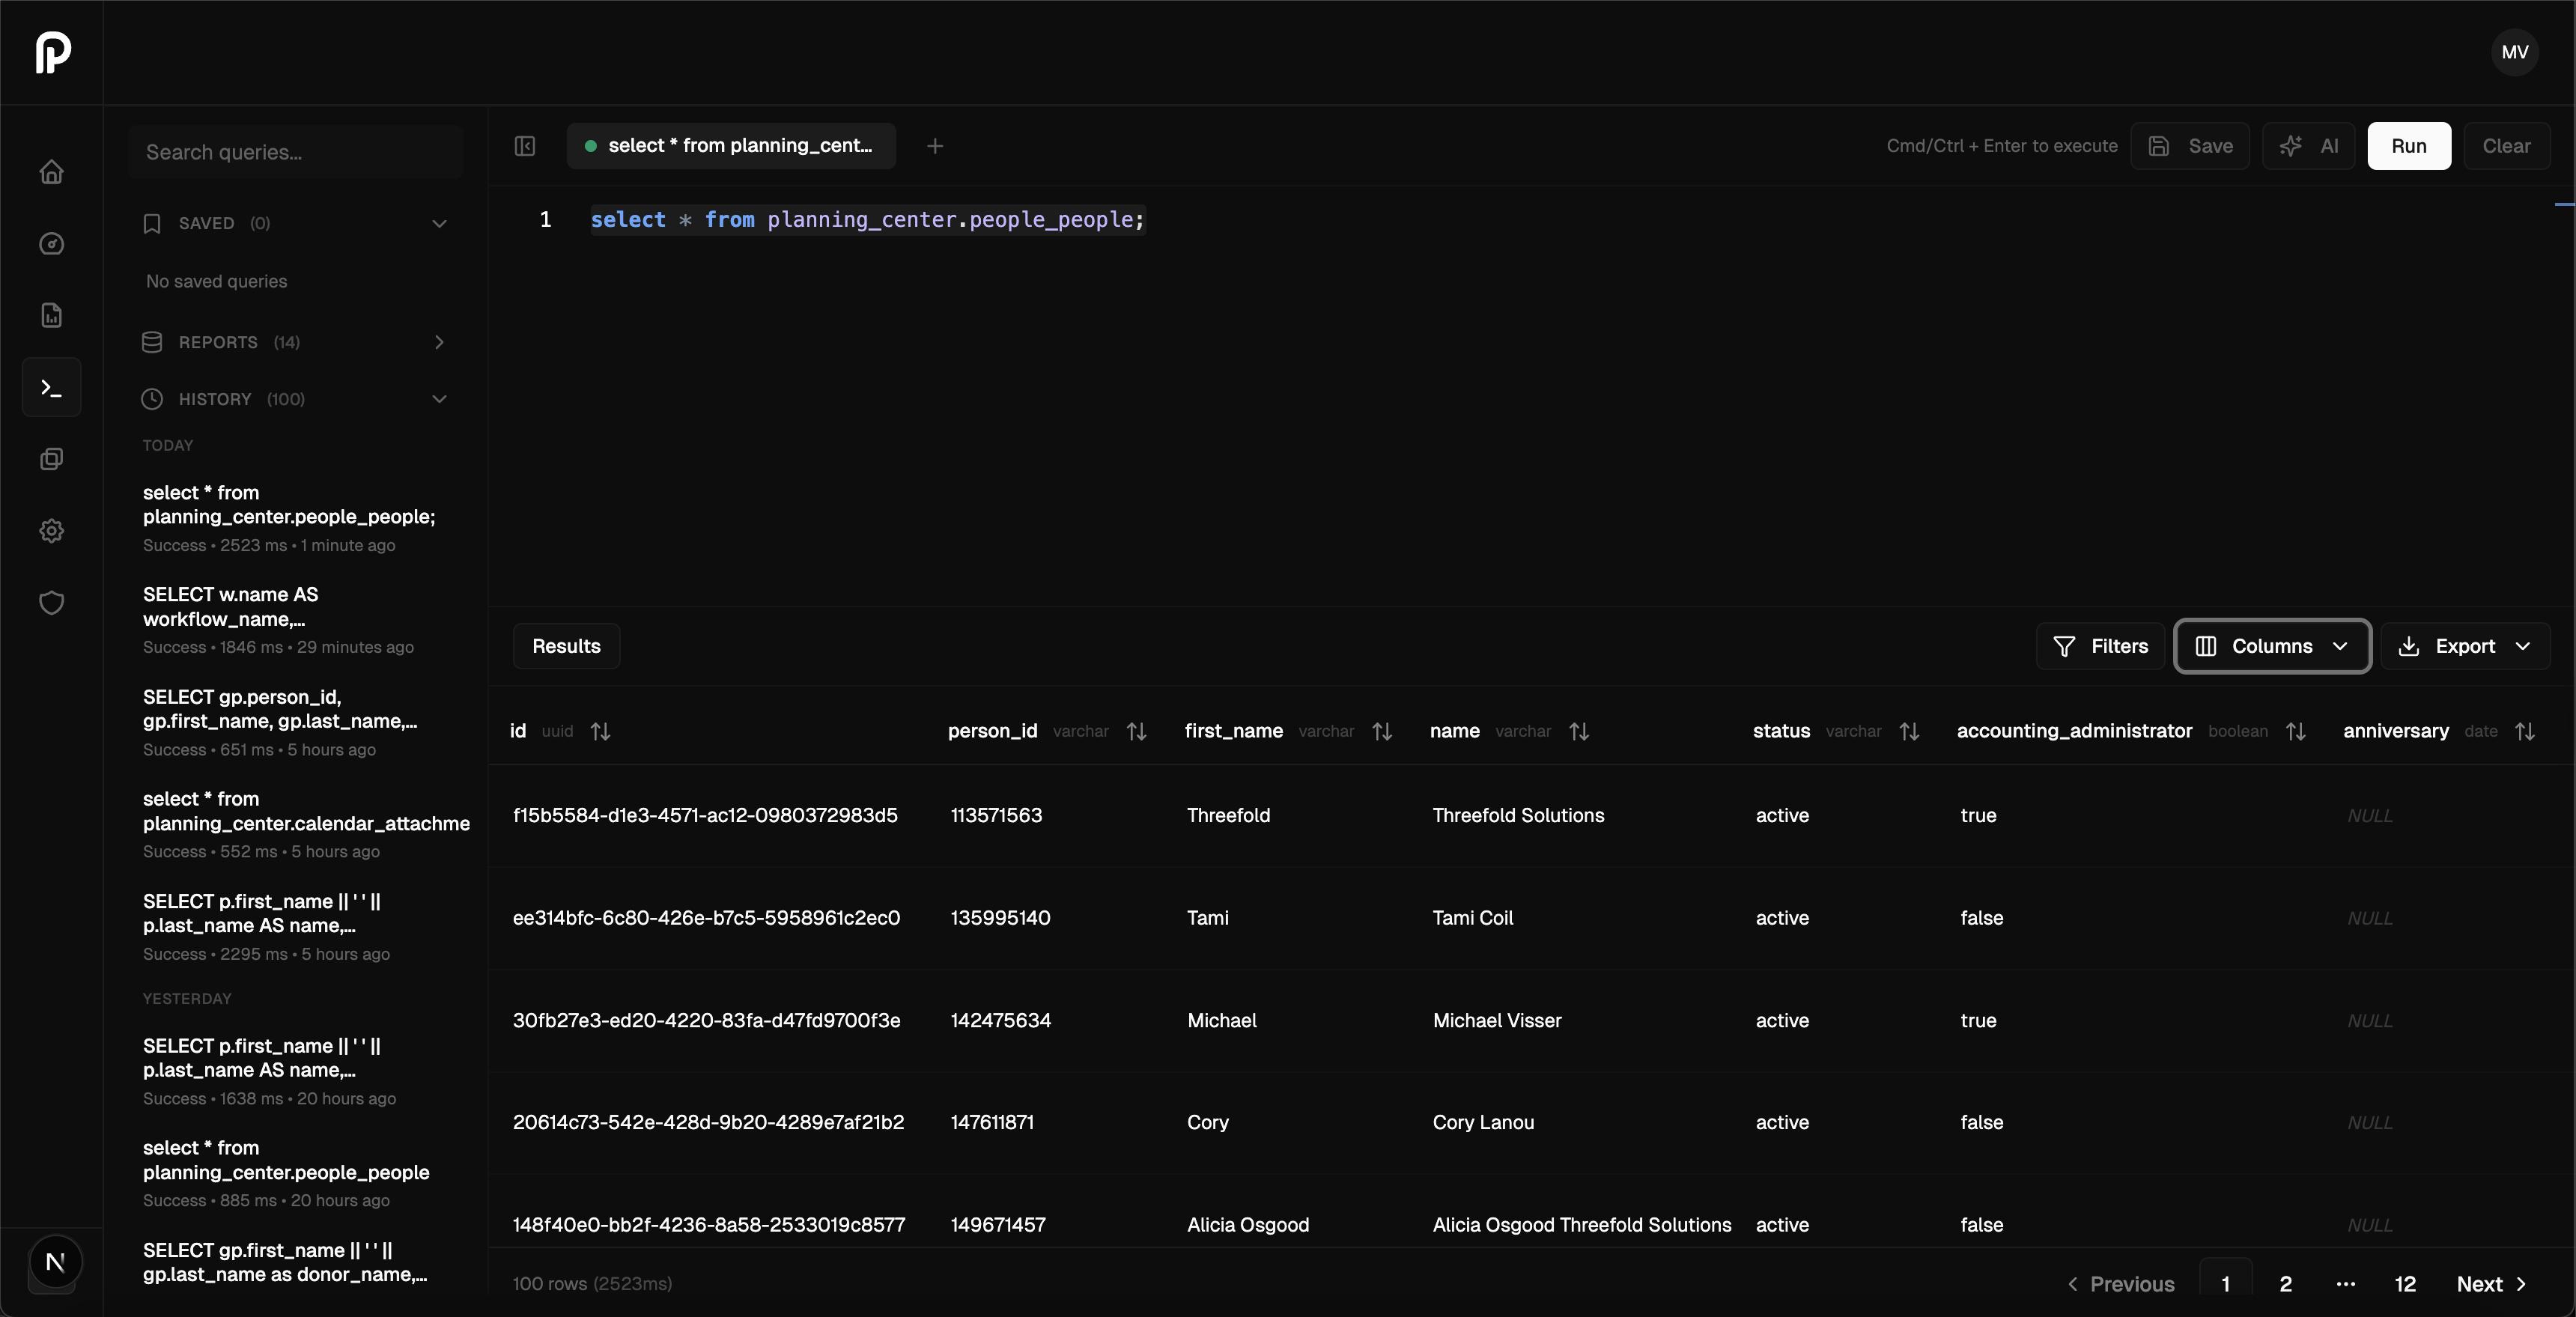
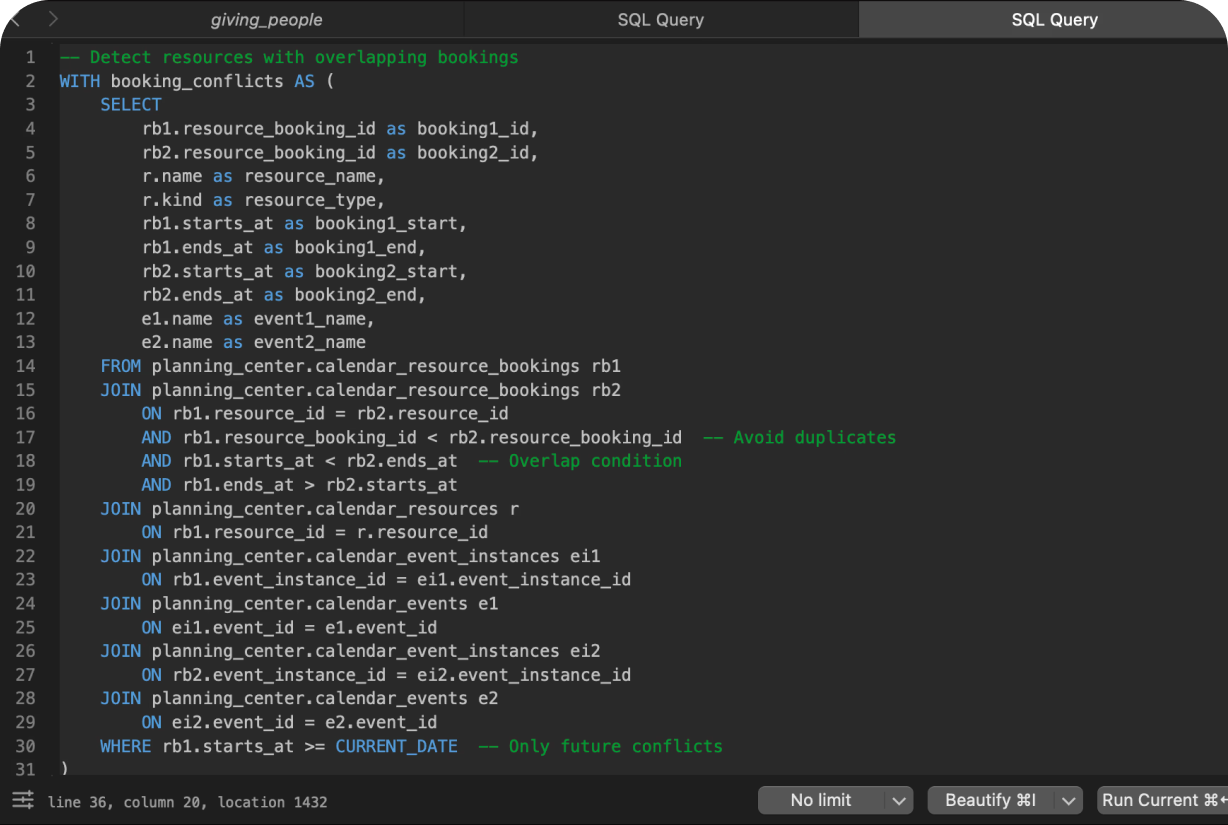
Power User? Go Deeper

Full SQL access to your data warehouse. Connect to Power BI, Tableau, or run any query you can imagine.
Dashboard showing 13 week rolling attendance with an average of 737, split into adults and kids, and a 70% attendance increase.
Built for the whole team

For Admins

Every Monday starts the same way—exports, formulas, formatting. By the time you send the report, it's already outdated.

With Parable, you're one question away from any answer. Ask "What was our attendance last weekend?" and get it in seconds—not hours. No spreadsheets. No waiting.
Schedule Your Demo
Dashboard screen showing six app options to connect: People membership database, Giving tithes and offerings, Check-Ins attendance tools, Groups community engagement, Registrations signups and payments, and Services worship planning.
Dashboard showing attendance, growth track participation, workflows, donations, guest averages, donor activity, group participation, and salvation statistics with charts and numbers.

For Ministry Pastors

You're leading a ministry but flying blind. Attendance feels flat, but is it? Are people actually engaging—or quietly drifting away?

Parable puts answers at your fingertips. Ask "Who's attended groups but hasn't been back in 3 weeks?" and know exactly who needs follow-up—before they disappear.
Schedule Your Demo

For Leadership

Board meetings shouldn't start with "I don't have that number." But when leadership asks follow-up questions, you're stuck going back for more data.

With Parable, every follow-up is one question away. Ask "How does giving compare to last year?" and answer in real time—not next week. Lead with confidence, not caveats.
Schedule Your Demo
SQL query detecting overlapping resource bookings by joining calendar resource bookings and event instances, filtering for future conflicts.
Features

Unique Features That Make a Difference

Parable is purpose built to help pastors be Spirit-led, but data driven.  

Ask Your Data Anything

Want to know who's falling through the cracks? Which services are growing? How giving trends compare to last year? Just ask. Parable turns your questions into reports, charts, and answers—instantly.

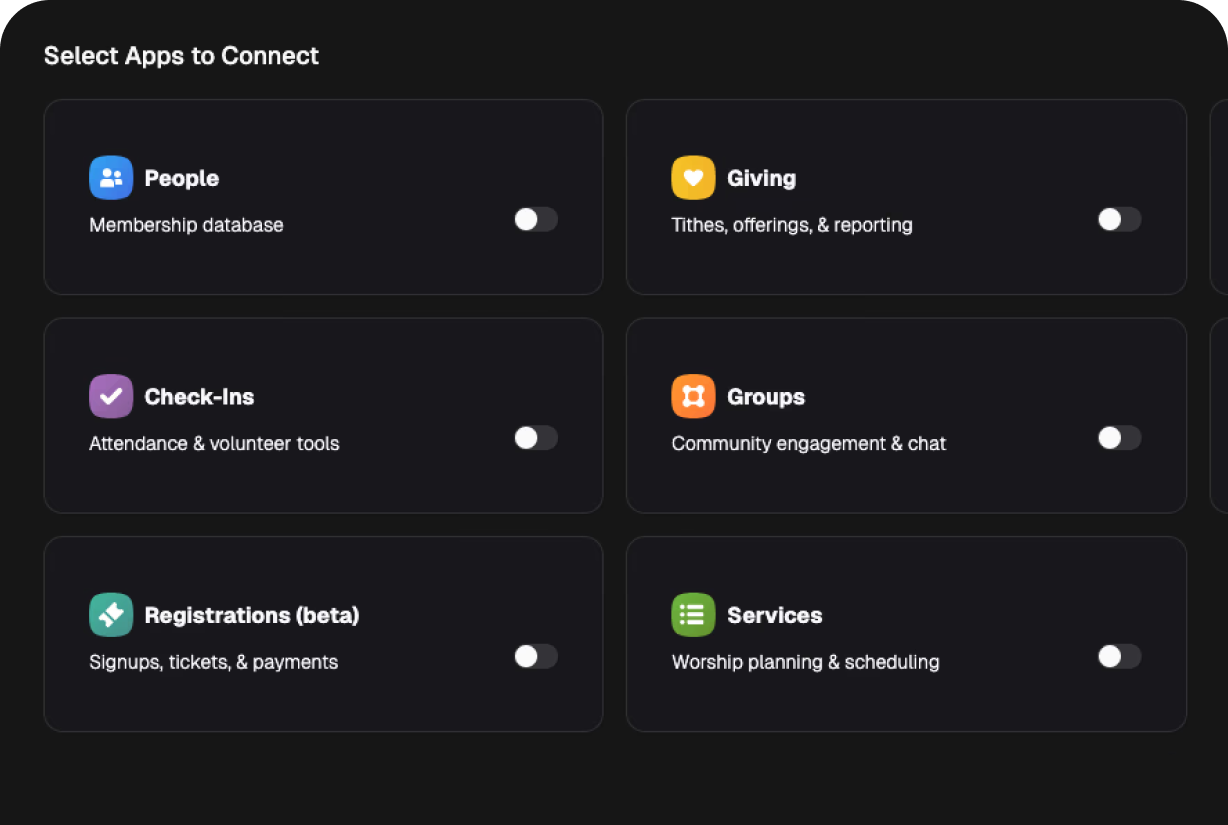
Automated Planning Center Sync

Connect once, stay current forever. Parable syncs your Planning Center data every night automatically—no exports, no manual updates, no stale reports.

Unified Data Source

All your Planning Center modules in one place. Finally see connections between giving, attendance, groups, and events that are impossible to spot when your data lives in silos.

Full Access for Power Users

Power users can query church data directly with SQL. Connect to Tableau, Power BI, or run any query you can imagine. Full access, zero restrictions.

Advanced Report Building

Build reports in minutes that would take hours in Planning Center—or an entire morning in Excel. Track year-over-year trends, create cohort analyses, and spot patterns spreadsheets can't reveal.

Export Anywhere

Export data in any format—CSV, Excel, or direct database connections. Connect to tools like Tableau, Power BI, or Google Sheets. Your data, your way, anywhere you need it.
Pricing

Affordable and Transparent Pricing

Our pricing is designed to grow with your church.
Billed yearly

Starter

500+ Active Members

$79/mo
$99/mo
Overview Dashboards
Automated Data Sync
AI Chat (50 chats per month)
Pre-built Reports
Try for free

Growth

2000+Active Members

$149/mo
$199/mo
Everything in Starter
AI Chat (500 chats per month)
Custom Report Building
Direct Database Access
Export to CSV/Excel
Try for free

Scale

5000+ Active Members

$349/mo
$399/mo
Everything in Growth
Multicampus Support
Tableau / Power BI Connections
Priority Support
Try for free

Enterprise

10000+ Active Members

Contact Us
Contact Us
Everything in Scale
SAML/SSO Auth
Dedicated Onboarding
Custom Integrations
SLA Guarantee
Get Started
FAQs

Your Questions About Parable Answered

Learn more about how Parable can transform your sales management.
What is Parable?

Parable is a reporting and analytics platform for churches using Planning Center. It connects to your Planning Center account, syncs your data automatically, and gives you dashboards, trends, and reports that stay current—no more Monday morning spreadsheet sessions.

How does Parable connect to Planning Center?

Parable uses Planning Center's official API to securely sync your data. Setup takes about 10 minutes and requires no technical skills—if you can log into Planning Center, you can connect Parable. Your data syncs automatically every night, or you can refresh on-demand anytime.

Is my data secure?

Yes. We use bank-level encryption, and your data is completely isolated—you only see your church's information, never anyone else's. We never sell or share your data. You control who on your team can access reports.

Do I need technical skills to use Parable?

No. Most users never touch anything technical. You can use pre-built dashboards, ask questions in plain English using our AI chat, or explore reports with point-and-click tools. For power users who want it, we also offer full SQL access to your data warehouse—but it's completely optional.

How is Parable different from Planning Center's built-in reports?

Planning Center is great at collecting data but limited at analyzing it. You can't see trends over time, connect data across modules (like comparing group attendance to giving), or ask custom questions. Parable fills that gap. It pulls all your Planning Center data into one place and lets you see patterns, run forecasts, and get answers Planning Center can't provide on its own.

Does Parable replace Planning Center?

Planning Center is great at collecting data but limited at analyzing it. You can't see trends over time, connect data across modules (like comparing group attendance to giving), or ask custom questionsParable fills that gap. It pulls all your Planning Center data into one place and lets you see patterns, run forecasts, and get answers Planning Center can't provide on its own.

What Planning Center modules does Parable support?

Parable connects to People, Giving, Calendar, Check-Ins, Groups, Publishing, Registrations, and Services. All your data flows into one unified view, so you can finally see how everything connects.

How long does setup take?

Simply connect your Planning Center account and let the initial sync run in the background. Depending on the size of your church, this first sync may take a few hours. Once it’s complete, you can immediately start exploring your data and building dashboards.

What if I'm not technical but need a custom report?

Two options: First, try asking our AI chat in plain English—something like "How many first-time guests returned last month?" Often that's enough. Second, our team can help you build custom reports during onboarding or anytime after.

What if I'm not happy with Parable?

We offer a free trial so you can see if it's right for your church. After that, you can cancel anytime—no long-term contracts, no cancellation fees.

Schedule Your Demo

Join the Movement: From Manual Reports to Automated Ministry Intelligence
Contact Us